Background
BRIC are formed by four countries, Brazil, Russia, India and China. This concept was proposed by economist, Jim O'Neil. In this four country, land coverage of both are big, total up coverage encompass over 25% of the world's land coverage. Not only that, BRIC also holding almost 40% of the world's population. A country population and demographic among other factors, directly affects the potential size of its economy and its capacity to function. So, large land coverages plus large population bring up their holding an account for more than 25% of global GDP.
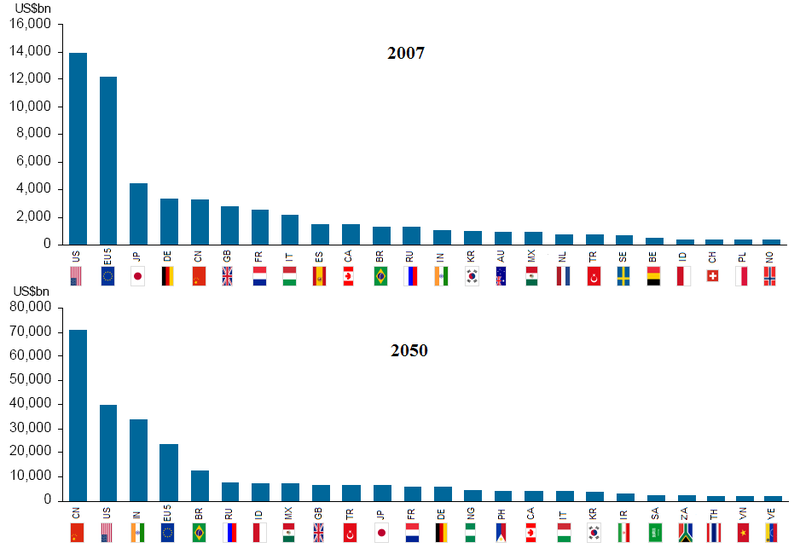
BRIC Countries: Path to 2050
As early as 2003, The Goldman Sachs, an American Multination Investment Banking forecasted that China and India would became the first and the third largest economies by 2050, while Brazil and Russia capturing the fifth and sixth spots. So that, China and India will become the dominant global suppliers of manufactured goods and services. Brazil and Russia beat the two countries with their abundance, Brazil has the largest area of farmland and forest in their world. As for Russia, the country has the richest content of natural gas, according to the data of EIA in 2007, its real reserves also rank second in the world.
Follow-up report of BRIC in 2004
The Goldman Sachs global economic team show that, in BRIC nations, the number of an annual income over a threshold of $3000 - a level consistent with an entry into the 'middle class' - could nearly double in the next three years and reach 800 million people with a decade may have crossed that threshold.
Second Follow-up report in 2007
This report complied by lead authors Tushar Poddar and Eva Yi to investigate into ' India's rising growth potential ' . In front we got said that a population could direct affect the potential size of its country's economy. Currently India has a total population of 1.1 billion and in 2030, it will surpass China to become the most populated country of the world.
In the revised 2007 figures, based an increased and sustaining growth, more inflows into foreign direct investment. Goldman Sachs predicts that from 2007 to 2020, India's GDP per capita in US terms will quadruple and will surpass by US by 2043.
A Changing Landscape ( Report in 2010)
In late 2010, China had surpassed Japan's GDP for the first time with China's GDP standing $4667 billions compared to Japan's $4604 billion. So China thus became the world's second - largest economy after US. The next targe of China is surpass US become the number one. So according the report from Goldman Sachs , by 2030 China will became the single largest equity market in the world.
According to the NIESR based on IMF, in 2011 Brazil has become the seventh biggest economy in the world by overtaking UK with $2.28 trillion and %2.21 trillion.
| List by the International Monetary Fund (2011) |
| |
|
| — | World | 78,969,782[4] |
| — |  European Union European Union | 15,852,690[4] |
| 1 |  United States United States | 15,075,675 |
| 2 |  China China | 11,299,987 |
| 3 |  Japan Japan | 4,444,139 |
| 4 |  India India | 4,420,563 |
| 5 |  Germany Germany | 3,113,927 |
| 6 |  Russia Russia | 2,383,364 |
| 7 |  Brazil Brazil | 2,294,178 |
| 8 |  United Kingdom United Kingdom | 2,287,865 |
| 9 |  France France | 2,213,780 |
| 10 |  Italy Italy | 1,846,922 |
| 11 |  Mexico Mexico | 1,666,531 |
| 12 |  South Korea South Korea | 1,554,124 |
| 13 |  Spain Spain | 1,405,787 |
| 14 |  Canada Canada | 1,395,374 |
| 15 |  Indonesia Indonesia | 1,124,631 |
|
Billionaires Center flow form Europe to BRIC
Based on Forbes report, the number of billionaires among their combined populations are exceeding the number of billionaires in Europe, which 301 over to 300 in 2011. China has 115 and Russian has 101 billionaires, the rest 85 person are distributed in India, 61 person and Brazil which has 24 persons.
Science and Technology in BRICS
Since year 2020, global spending on science R&D has increased by 45 percent to more than one trillion dolar. But from 2002 to 2007, BRIC had more than double their spending on this industry. India has established world-class science research institutions as well as universities to provide excellent and training for its young populations. This action is to ensure that the quality of people will increase and also increase their knowledge in this industry.
Conclusion
Until today 2012, we can discover that BRIC countries are using the rocket footstep to sync or overpass the Europe country. Especially India and China. In previous generation, people would not be hoped for this two country became the economy boss in countries Asia.
Lets said China. After Dynasty Qing of it became steadily deteriorate because they need to pay the large indemnity to Europe Country after the war. Plus, China in previous generation trust that they can be able to support oneself ( and supply one's own needs). So the foreign trade policies is not too strong. After Deng XiaoPing and the new Chinese leadership began to reform the economy then foreign trade was focused upon as a major vehicle of growth, leading to the creation of Special Economic Zones and first in ShenZhen. For India, P.V Narasimbu Rau and Nanntan Singh had official started the economy free reformation by the year 1991. They abolish the licence Raj, terminated the monopoly of government corporation, and moreover encourage the foreign trade in India. So with this kind of method, economy of India growing faster from 1991.
Brazil and Russia, they also got their own dominant position in the world although they are not the top strong economy countries in South American and Europe area. Brazil has the largest area of farmland and forest in the world, inside country got 3 hundred million tons land can be crop, it is over China's 3 times many. So that Brazil become the world largest producer of coffee, cocoa and cane. Hence, it has become the world third farm produce export country.
In BRIC, u will recognise that all of them got one collaborate point, by changing the political and economic systems to embase global capitalism. If country only got the dominant position but dont have any effective political and economic system, it's useless to have all of abundant of these. The country's economy worse or good, one of the factor will be depend on how they use their dominant position to developing. Some country like Singapore, it dont get any advantages in their land, but they can get the good GDP results compare to other countries which got more land coverage, natural resources and etc. So, having the robust political and economic system are the important point to affect the countries's GDP.
Additional Information of BRIC - Why Mexico, South Korea, Indonesia and South Africa will not include in BRIC
Mexico and South Korea
Mexico and South Korea are the two countries which considered to ' have the capacity to become as important globally as the BRIC'. Both did not included in BRIC group because of they were already too much farther along in their economic development then the BRIC and were not likely to attain the economic stature or global influence of the original four BRIC countries.
Indonesia and South Africa
Indonesia and South Africa compare to Brazil ( the smallest GDP amount in BRIC by year 2011) , first , one of the BRIC requirement is large population. South Africa's population of 51 million people, a fraction of Brazil's 193 millian and China's 1.34 billion people, is too small for BRIC status. Besides that, South Africa's GDP at roughly 554 million in 2011 was less than one quarter that of Brazil's about 2.29 billion.
Indonesia with a great population in 237 million in 2010 was more than 4 larger than South Africa, and briefly more than Brazil. Besides that GDP of Indonesia with 1.12 billion in 2011 was double that of South Africa. But , the only reason he cant include in BRIC is compare to Brazil, it was still less than half size of Brazil's economy.
List of countries by population
|
| 1 | China[7] | 1,347,350,000 | December 31, 2011 | 19.1% | Official estimate |
| 2 | India | 1,210,193,422 | March 1, 2011 | 17.16% | 2011 census |
| 3 | United States | 314,785,000 | November 18, 2012 | 4.46% | Official population clock |
| 4 | Indonesia | 237,641,326 | May 1, 2010 | 3.37% | 2010 census |
| 5 | Brazil | 193,946,886 | July 1, 2012 | 2.75% | Official estimate |
| 6 |  Pakistan Pakistan | 181,255,000 | November 18, 2012 | 2.57% | Official population clock |
| 7 |  Nigeria Nigeria | 166,629,000 | July 1, 2012 | 2.36% | UN estimate |
| 8 |  Bangladesh Bangladesh | 152,518,015 | July 16, 2012 | 2.16% | Official estimate |
| 9 | Russia | 143,228,300 | September 1, 2012 | 2.03% | Official estimate |
| 10 | Japan | 127,530,000 | October 1, 2012 | 1.81% | Monthly official estimate |
| 11 | Mexico | 112,336,538 | June 12, 2010 | 1.59% | 2010 census |
| 12 |  Philippines Philippines | 92,337,852 | May 1, 2010 | 1.31% | 2010 census |
| 13 |  Vietnam Vietnam | 87,840,000 | July 1, 2011 | 1.25% | Official estimate |
| 14 |  Ethiopia Ethiopia | 84,320,987 | July 1, 2012 | 1.2% | Official estimate |
| 15 |  Egypt Egypt | 82,846,000 | November 18, 2012 | 1.17% | Official population clock |
| 16 | Germany | 81,857,000 | April 30, 2012 | 1.16% | Monthly official estimate |
| 17 |  Iran Iran | 75,149,669 | October 24, 2011 | 1.07% | 2011 census |
| 18 |  Turkey Turkey | 74,724,269 | December 31, 2011 | 1.06% | Official estimate |
| 19 |  Democratic Republic of the Congo Democratic Republic of the Congo | 69,575,000 | July 1, 2012 | 0.99% | UN estimate |
| 20 |  Thailand Thailand | 65,479,453 | September 1, 2010 | 0.93% | 2010 census |
| 21 | France[8] | 65,350,000 | January 1, 2012 | 0.93% | Official estimate |
| 22 | United Kingdom | 62,262,000 | July 1, 2010 | 0.88% | Official estimate |
| 23 | Italy | 60,849,247 | March 31, 2012 | 0.86% | Official estimate |
| 24 |  South Africa South Africa | 51,770,560 | October 9, 2011 | 0.73% | 2011 census |
| 25 | South Korea | 50,004,441 | July 1, 2012 | 0.71% | Official estimate |